

The short answer
On September 2, 2026, Google announced that monthly historical snapshots in Places Insights are generally available, with records going back to January 2024. Google also made its PLACES_COUNT_CHANGE function generally available and said historical tables now include rating and rating-count fields. This is a BigQuery data product for analysts with approved access—not a time-travel control in consumer Google Maps. Its comparisons describe changes in selected place records; they do not, by themselves, prove that a storefront opened or closed.
What changed on September 2
Historical Places Insights data was not invented in this release. Google’s release notes show an experimental historical-data launch on October 10, 2025, after Places Insights itself became generally available on September 30, 2025. The September 2026 change advances the historical snapshots from that experimental stage and adds a simpler supported path for comparing two months.
| Area | Before the update | September 2 announcement |
|---|---|---|
| Historical snapshots | Available experimentally; analysts could work with historical tables. | Generally available, with monthly records back to January 2024. |
| Historical rating fields | An older experimental guide said rating and user_rating_count were excluded. |
Google says rating and rating-count data are now included in historical tables. |
| Month-to-month comparison | Possible through historical-table analysis and snapshot-specific queries. | PLACES_COUNT_CHANGE is generally available to compare two monthly snapshots in one query. |
| Filters | Existing functions had their documented filter sets. | Google added snapshot_date, regular-hours, and EV-connector filters to three named Places Count functions. |
The filter announcement names PLACES_COUNT_PER_H3, PLACES_COUNT_V2, and PLACES_COUNT_PER_TYPE_V2. It should not be read as saying every new filter belongs to PLACES_COUNT_CHANGE. That comparison function has its own required month1 and month2 parameters.
This is not consumer map time travel
Places Insights exposes statistical analysis of Google Maps’ Places records through BigQuery, Google’s cloud data warehouse. A point of interest, or POI, is a mapped place such as a restaurant, clinic, school, park, or charging station. The product is aimed at analysts working with geographic areas and filters, not at someone opening the ordinary Maps app.
The update does not add a historical slider to Google Maps, restore a person’s Timeline, reveal past Street View imagery, or change Google Earth’s historical-imagery tools. It also does not provide an unrestricted archive for download. A user must request Places Insights access, use a Google Cloud project, enable the required services, and subscribe to the relevant country or city listing.
How a monthly comparison works
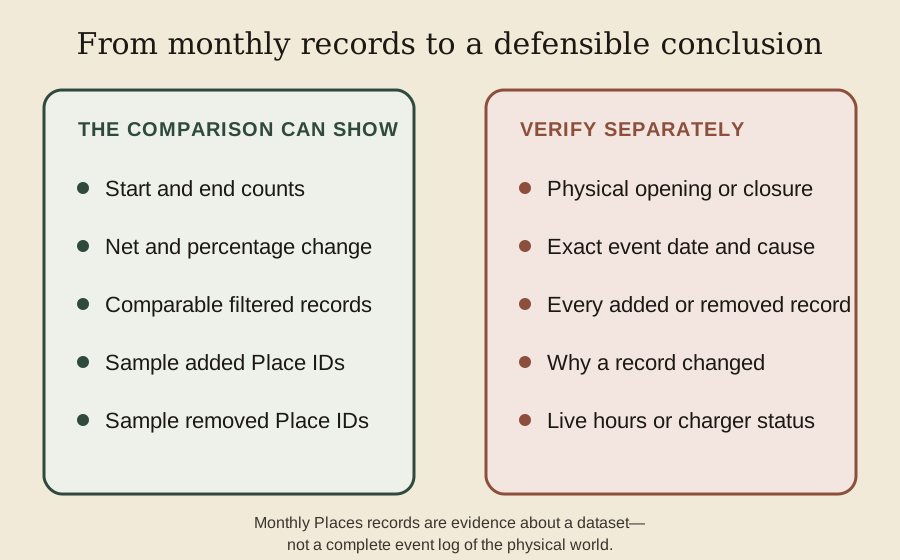
PLACES_COUNT_CHANGE accepts a table of input geographies—a collection of points, polygons, or other BigQuery geography objects—and filters that identify the two months. For each area, the current reference lists a starting count, ending count, net change, percentage change, and compound monthly growth rate. It also returns arrays of sample Place IDs that appear in one selected month but not the other.
Comparability matters more than the apparent precision of the output. Keep the geographic boundary, place types, business-status choice, and other filters the same when the research question is “what changed between these months?” If the boundary expands or the category changes, the difference no longer isolates time.
The words sample and recorded matter too. Google’s schema defines added_count and removed_count as the number of IDs in the corresponding sample arrays. Those fields should not be presented as exhaustive counts of real businesses that opened and closed.
A worked Example District
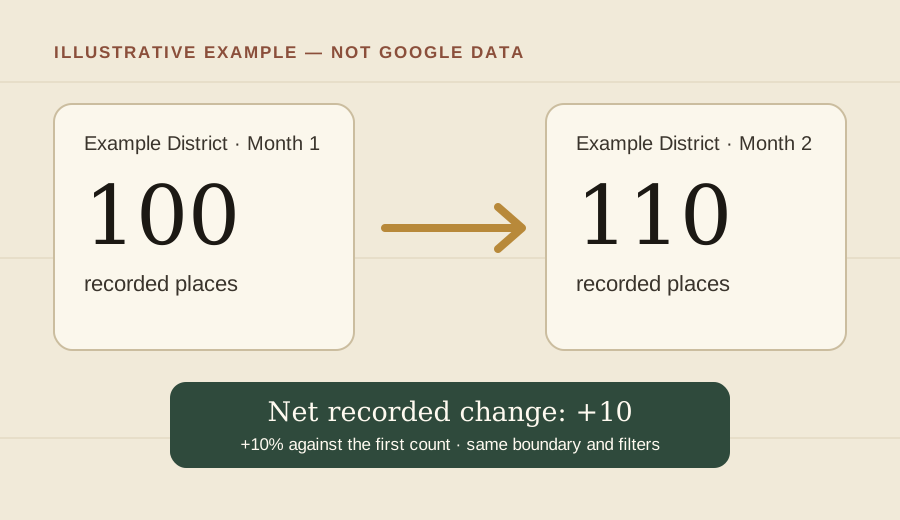
Illustrative example using hypothetical data. Suppose the same boundary and filters return 100 recorded places in the first monthly snapshot and 110 in the second. The net difference is 110 − 100 = +10 places. Against the first count, that is +10%.
That does not tell us how much turnover occurred. In one hypothetical full-set scenario, 15 records could have been added and five removed, also producing a net change of +10. Those 15 and five are teaching numbers, not PLACES_COUNT_CHANGE sample sizes and not measured openings or closures. If the starting count is zero, ordinary percentage growth is undefined; report the absolute change and check the service’s documentation before interpreting its percentage field.
Access, costs, and coverage
Google’s setup guide requires a Places Insights access request, a Google Cloud account, BigQuery and Analytics Hub services, suitable permissions, and a subscription to each needed listing. Both sample and full listings are documented, but availability is tied to the listed cities and countries. This is not a promise of identical coverage everywhere.
The query route also changes the rules. Places Count functions can return exact low counts, including zero, but enforce a minimum search area. Direct SQL against the underlying tables allows more flexible analysis and no minimum area, while an aggregation threshold omits result rows whose count is from zero through four. A limitation from one route should not be copied onto the other.
Google’s pricing page does not publish one simple price for Places Insights; it says standard BigQuery quotas apply and directs prospective users to contact sales about product pricing. Costs can apply; check pricing before subscribing.
Historical fields also have ordinary data limits. The core schema marks fields such as ratings, opening hours, and EV connector details as nullable, so their availability does not guarantee a value for every place. A historical rating is a snapshot field, not an archive of every individual review. Configured opening hours are not proof a place is open now, and recorded connector type or maximum charge rate is not live charger availability.
What a record change can—and cannot—say
A record may differ because a place entered or left the selected population, its status or type changed, its attributes were updated, coverage changed, or an identifier changed. The comparison identifies the data difference; it does not necessarily identify the cause or the day a physical event happened.
This is why “ten more recorded restaurants” is a defensible first result while “ten restaurants opened” is a conclusion that needs more evidence. Sample Place IDs may help an analyst investigate particular records through other authorized services, but a sample is not the entire changed set. Missing and null values should not be silently turned into zero, and absence from one filtered result is not proof that a physical place ceased to exist.
Why this matters for map-based research
For food or service provision, comparable snapshots could show whether the recorded distribution of grocery stores, clinics, or restaurants changed across neighborhoods. A researcher could then compare the pattern with permits, field observations, local directories, or dated reporting before making a claim about access or closures.
For transport research, the new EV-related filters could help compare the recorded distribution of charging places or connector characteristics. The result would describe Places records, not whether a charger was working or available at a particular moment. In both examples, analysts should keep the boundary and filters stable, record the snapshot months, check the listing’s geographic coverage, and preserve enough method detail for another reader to understand the comparison.
The same discipline belongs in student work. The digital learning resources guide explains how to keep dates, sources, and uncertainty attached to mapped claims, while the student map projects guide provides a process for documenting evidence and limitations.
Examples
Example District and its numbers are hypothetical, not query results.
An indexed copy of the older experimental guide excluded rating fields, while the September 2 release announced their inclusion; individual historical rating values may still be absent.
The Maps Guide background reading: Street View dates and older images for historical photographs, and mapping research and source notes for classroom comparisons.


